Our mission
To help development organisations know what is working, for whom and why, through rigorous research and data systems built for their context.
Ellipsis is a development agency working to bring precision to development across East and Central Africa.
About
Ellipsis Data Group is a mission-driven development agency that works through a network of research specialists, developers and enterprises. We deliver research, MEAL and data systems work, and design information management systems for NGOs, SMEs, community-based organisations (CBOs) and local actors. A small core team stays responsible for quality and client contact, and draws on vetted specialists from the network for each assignment.
We are committed to bringing precision to development agencies' programming and outcomes. Based in Nairobi, we have associate networks in Kenya, Somalia, Ethiopia, South Sudan, Uganda, Tanzania, Rwanda and Burundi.
To help development organisations know what is working, for whom and why, through rigorous research and data systems built for their context.
Communities across East and Central Africa served by programmes that learn and adapt from reliable evidence.
Four standards apply to every piece of work that leaves Ellipsis, whether it is a survey, a dashboard or a report.
Tools, data and reports are checked by a second reviewer before they reach you, so errors are caught by us, not by your donors.
Every finding traces back to the data behind it, with the sources, methods and limitations stated plainly.
We write and visualise for the people who decide: short, clear and specific about what the evidence means and what to do next.
We hand over clean data, code and documentation, so anyone can rerun the analysis and get the same results.
A Nairobi hub linked to associates across eight countries. Each assignment is staffed from the network by people who know the context.
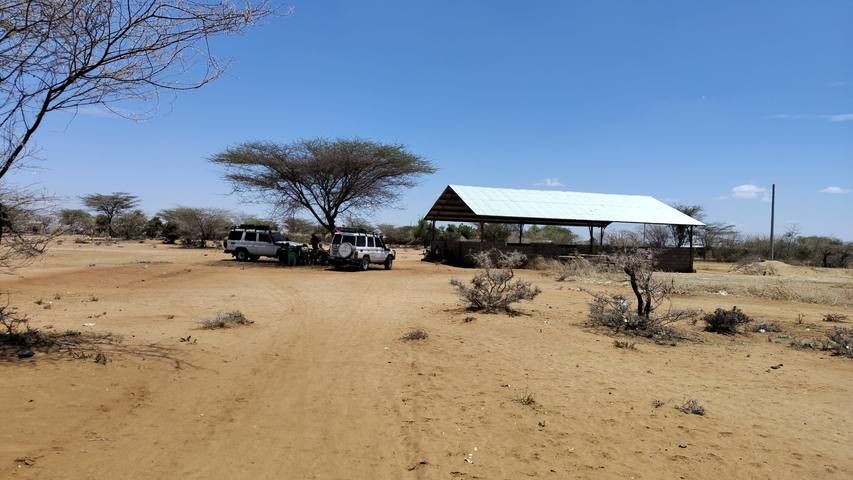
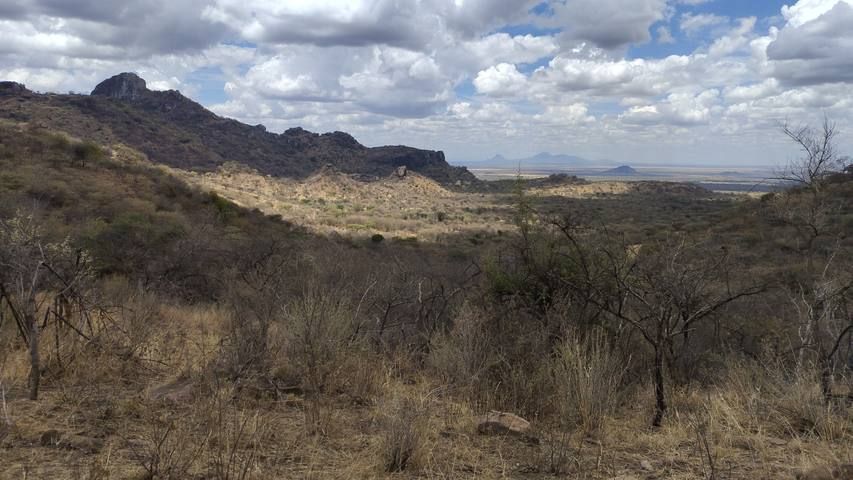
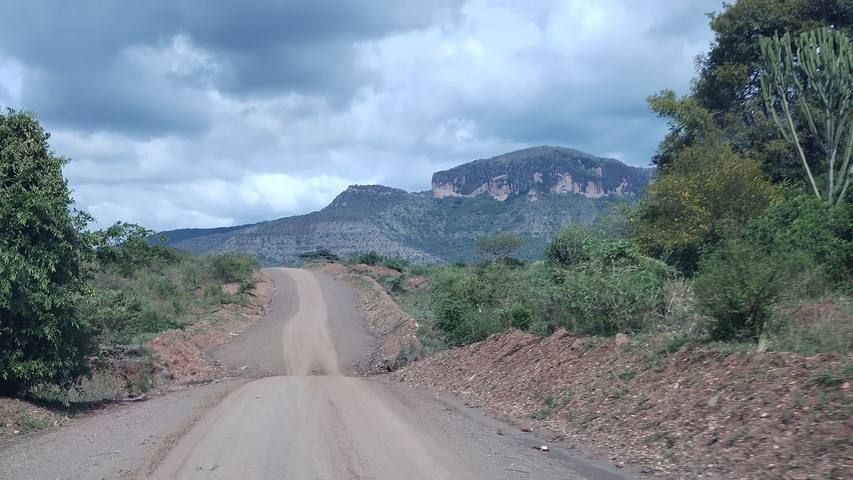
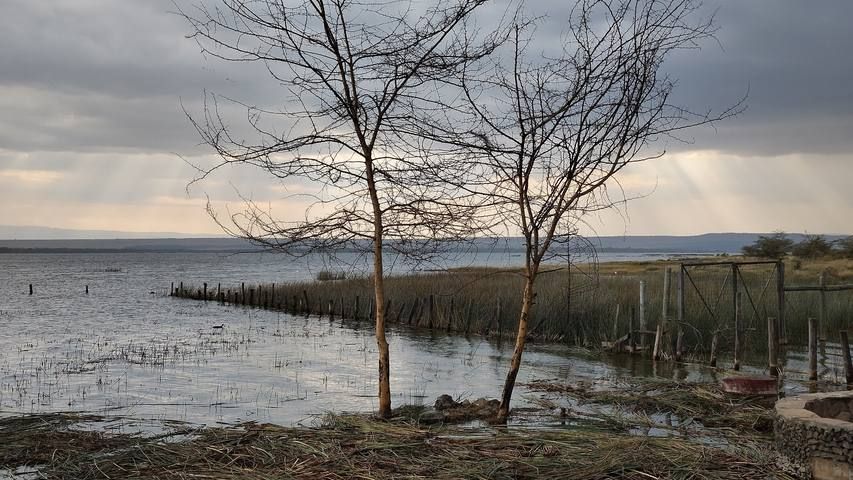
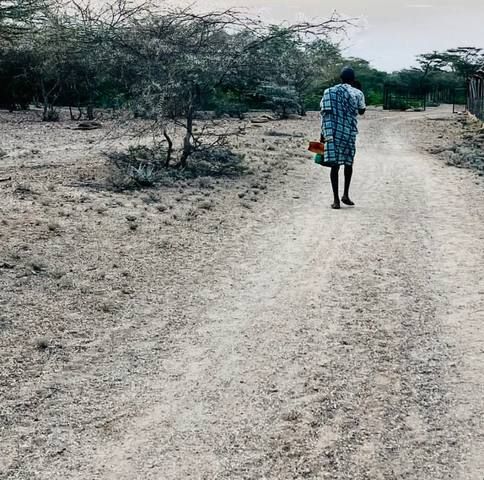
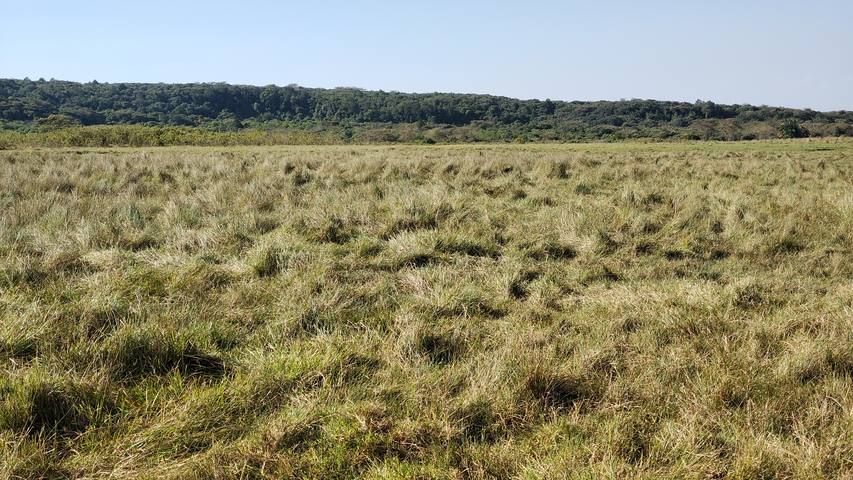
The places and communities our work starts from.



About · Join us
Ellipsis is a development agency built on a network. We bring together skills, enterprises and expertise so that people working in development can share what they know and keep learning from one another.
We welcome research specialists and developers on a rolling basis. Members share knowledge across the network, and we match them to assignments that fit their schedule and expertise.
We use your details only to match you to assignments, and handle them in line with Kenya’s Data Protection Act, 2019.
Services
Ellipsis Data Group helps NGOs, governments and donors collect reliable data, measure what matters and turn evidence into decisions.
Studies and evaluations designed for the context you work in.
Analysis that answers the question behind the question.
Tools that keep your data flowing after we leave.
Our information management systems give schools, landlords and programme teams an exact record of every transaction and every result, so decisions rest on numbers, not memory.
A fictional climate anticipatory action project, used to show how Ellipsis links a theory of change to a MEAL framework, an indicator framework and a live dashboard. Names, places and figures are invented for illustration.
If forecasts trigger pre-agreed support before a drought peaks, and communities and county teams are ready to act on them, then households can protect their livestock, food and income instead of selling assets in distress, because acting early costs less and saves more than responding after the shock.
The MEAL framework turns each level of the theory of change into what we monitor, how we evaluate it, how communities hold the project accountable, and what we learn.
| Level | Result statement | Monitoring | Evaluation | Accountability | Learning |
|---|---|---|---|---|---|
| Impact | Households protect lives, livelihoods and assets ahead of drought | Seasonal food security and livestock condition data | Endline with comparison group (difference-in-differences) | Results shared at community barazas | Was early action worth its cost? |
| Outcome 1 | Households act early and avoid distress sales | Post-distribution monitoring, 4 weeks after transfer | Baseline and endline household survey | Feedback hotline and help desks | Which support best protected assets? |
| Outcome 2 | Communities and counties trigger action on time | Trigger log and activation timeline | Process review after each activation | Committee minutes published locally | Did the triggers fire at the right time? |
| Outcome 3 | Evidence shapes decisions | Use of findings in county plans | Outcome harvesting at year end | Learning briefs shared with participants | What changed because of the evidence? |
| Outputs | Support, warnings, training and reviews delivered | Kobo distribution and training records, weekly | Data quality assessment twice a year | Selection criteria posted publicly | Where are delays or exclusion happening? |
| Activities and inputs | Resources used as planned | Workplan and budget tracking, monthly | Mid-term review | Complaints closed within 14 days | Are we spending where it matters? |
Each indicator has a clear definition, baseline, target, source and owner, so the numbers on the dashboard mean the same thing to everyone.
| Code | Indicator | Baseline | Target | Source and method | Frequency | Disaggregation |
|---|---|---|---|---|---|---|
| Impact and outcomes | ||||||
| IM1 | % of households with an acceptable food consumption score during the drought peak | 38% | 60% | Household survey (FCS) | Baseline, endline | Sex of head, ward, wealth group |
| OC1.1 | % of supported households reporting no distress sale of livestock | 41% | 70% | Post-distribution monitoring | Each activation | Sex of head, ward |
| OC1.2 | Average livestock herd retained (tropical livestock units) | 3.1 | 4.0 | Household survey | Baseline, endline | Ward, livelihood type |
| OC2.1 | % of activations where support started within 7 days of the trigger | 0% | 90% | Trigger and distribution logs | Each activation | Ward |
| OC3.1 | Number of county or partner decisions informed by project evidence | 0 | 4 | Outcome harvesting | Annual | Type of decision |
| Outputs | ||||||
| OP1.1 | Number of households receiving anticipatory cash before the drought peak | 0 | 5,000 | Kobo distribution records | Weekly | Sex of head, disability, ward |
| OP2.1 | % of targeted households receiving an early warning message | 35% | 90% | Phone survey (sample) | Each activation | Sex, age group, channel |
| OP2.2 | Number of committee members trained on triggers and early action plans | 0 | 240 | Training attendance records | Quarterly | Sex, age group, ward |
The dashboard refreshes from the Kobo forms, so the team sees progress against targets as the activation happens.
Illustrative data. In the sample, Ward E and female-headed households lag behind, which the dashboard flags for follow-up before the next activation.
Briefs, guides and sample work that show how we approach data and evidence.
Sample work · Data analysis
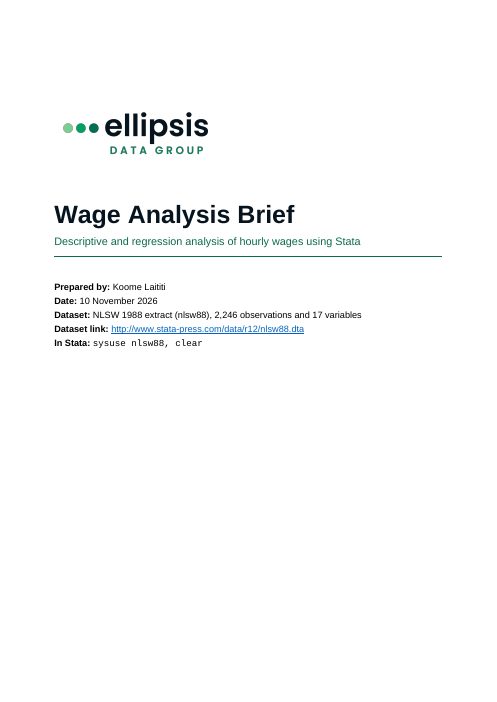
Uses the public NLSW 1988 dataset (2,246 workers) to show how education, experience, union membership, industry and location explain differences in hourly wages.
Read the brief (PDF)Practical courses for programme, MEAL and data teams, delivered in person or online.
Ready-made courses on core skills, adapted to your team’s level.
Designed around your programme, your tools and your data, with your team’s real work as the exercises.
Portfolio & Partnerships
We do not start from a favourite method. The choice depends on the context of the assignment, the rigour the decision needs, and how reproducible the results must be.
Quantitative
Compares change over time in a group that took part with a similar group that did not, to estimate what the programme itself caused.
Best for: impact questions where a randomised trial is not possible.
Theory-based
Tests the theory of change step by step against evidence, to build a credible case for how far a programme contributed to the results seen.
Best for: complex programmes with many actors.
Participatory
Starts from the changes that actually happened, then works backwards to verify them and find out who and what contributed.
Best for: advocacy, policy and capacity work where outcomes are hard to predict.
Participatory
Collects stories of change from participants and has stakeholders select and discuss the most significant, revealing what people value.
Best for: learning reviews and community-led programmes.
Qualitative
Uses mapping, seasonal calendars and ranking exercises so communities analyse their own situation alongside the research team.
Best for: needs assessments, livelihoods and climate risk studies.
Qualitative
Participants trace the high and low points of their lives over time, placing a programme’s effects within their wider experience.
Best for: displacement, reintegration and resilience research.
Data standards
Traces data from the point of collection to the final report, checking validity, reliability, timeliness, precision and integrity.
Best for: organisations reporting to donors on indicators.
Early warning, trigger design, community disaster risk management and early action evaluation.
Pastoral and agro-pastoral livelihoods in arid and semi-arid lands, natural resource management and land restoration.
Refugee, returnee and host community research, reintegration and self-reliance.
How international and local actors share power, funding and decisions.
Trust, access and service uptake in fragile and conflict-affected settings.
Impact assessments and safeguards monitoring for infrastructure and community projects.
Ellipsis gives part of its time to communities and community-based organisations (CBOs) that could not otherwise afford research, MEAL or data systems support. If you would like to support this work with funding, equipment, data or your own time, we would be glad to talk.
Let us know how our services can plug into your ecosystem to enhance precision.